

Table of Contents

Get Custom eCommerce Fulfillment Service
Book a Meeting

Safety Stock for Ecommerce: How Much Inventory Should You Hold in China?

Time: Aug 28,2026 Author: SFC Source: www.sendfromchina.com
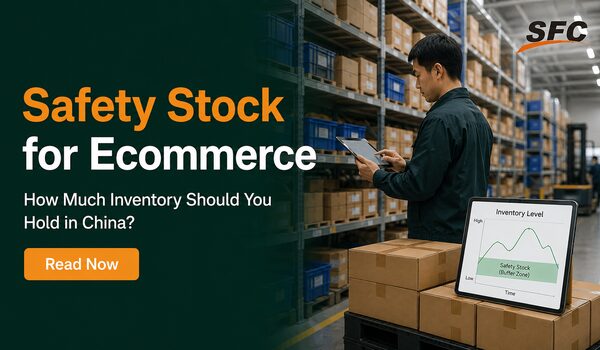
Safety stock is a bit like keeping an extra umbrella by the door. One spare is sensible. A garage packed with 600 umbrellas is not “extra safe.” It is a storage problem.
 
Ecommerce inventory works the same way.
safety-stock-for-ecommerce
Too little safety stock creates stockouts, canceled orders, emergency air freight, unhappy customers, and lost marketplace momentum. Too much ties up cash, collects storage fees, and slowly turns yesterday’s bestseller into tomorrow’s clearance item.
 
For products manufactured or stored in China, the decision gets trickier. Your replenishment lead time may include factory production, inspection, domestic transport, warehouse receiving, export preparation, international transit, customs, and destination receiving. And the buffer does not have to sit in one place. Some can remain in China while another portion sits close to customers.
 
So the practical question is not only, “How many units of safety stock do I need?”
 
It is three questions:
 
  1. Quantity: How much total buffer does each SKU need?
  2. Location: Should that buffer sit at the supplier, in a China warehouse, near customers, or across several locations?
  3. Timing: When should you reorder or rebalance it?
This guide covers the formulas, but it stays grounded in those three decisions. Because, honestly, a beautiful spreadsheet is not much help when the wrong stock is sitting on the wrong side of the ocean.


What Safety Stock Is—and What It Is Not

Safety stock is extra inventory held to protect against uncertainty in demand, replenishment lead time, or both. It is also called buffer stock or reserve inventory.
safety stock for ecommerce
It is not all the inventory you expect to sell before the next purchase order arrives.
 
Here are the main inventory buckets:
 
Inventory Type
Purpose
Simple Example
Cycle stock
Covers expected demand between planned replenishments
The normal units sold between purchase orders
Safety stock
Covers unexpected demand or delay
Extra units kept for a supplier delay
Pipeline inventory
Stock already moving through production or transport
Goods on a vessel or in customs
Seasonal stock
Covers a known future demand increase
Inventory purchased for a holiday campaign
Dead or obsolete stock
Inventory unlikely to sell normally
Old packaging after a product redesign
 
This distinction matters. A known holiday forecast is not safety stock. It is planned demand. Safety stock should cover the uncertainty around that forecast.
 

Safety Stock Versus Reorder Point

Safety stock tells you how much buffer to keep. The reorder point tells you when to place the next replenishment order.
 
The basic formula is:
 
Reorder point = expected demand during replenishment lead time + safety stock
 
Suppose an SKU sells 20 units per day. Replenishment takes 30 days, and the calculated safety stock is 180 units.
 
Reorder point = (20 × 30) + 180 = 780 units
 
When the inventory position reaches 780 units, you reorder. That does not mean you order 780 units. The purchase quantity depends on MOQ, order cycle, forecast, cash, and target inventory.
 
Also use inventory position, not only the physical stock visible on one warehouse shelf:
 
Inventory position = usable on-hand inventory + confirmed inbound inventory − allocated orders − backorders
 
If you ignore stock already in transit, you may reorder twice and create a lovely mountain of excess inventory.


Why China-Sourced Ecommerce Needs a Different Lead-Time View
Many safety-stock examples treat lead time as one neat number. “Supplier lead time: 30 days.” Done.
 
Real China replenishment is often a chain of smaller clocks.
safety stock for ecommerce

The Four Lead-Time Layers

1. Production Layer

This may include component availability, production scheduling, manufacturing, quality inspection, rework, packing, and the supplier’s release process.
 

2. Origin Layer

After production, stock may need domestic pickup, receiving, counting, consolidation with other suppliers, labeling, kitting, export-ready packaging, and carrier booking.
 

3. Cross-Border Layer

This covers departure cutoffs, flight or vessel capacity, international transit, transshipment, customs clearance, congestion, and carrier exceptions.
 

4. Destination Layer

Inventory may still need unloading, customs release, destination-warehouse receiving, counting, putaway, and system availability before it can fulfill an order.
 

Which Lead Time Belongs in the Formula?

Use the lead time from the replenishment decision to the moment inventory becomes usable at the location you are protecting.
 
  • If you hold finished goods in a China warehouse and replenish directly from the factory, the relevant lead time may end when the China warehouse receives usable stock.
  • If you protect inventory in a US warehouse, the lead time may include China production, origin processing, international shipping, customs, and US receiving.
  • If you replenish Amazon FBA, include the time until stock becomes available for sale, not merely the carrier-delivery date.
  • If you operate a hybrid network, the China buffer and destination buffer protect different risk windows.
That last point is important. A unit held in Shenzhen cannot provide next-day delivery to a customer in Chicago. But it can protect the next replenishment shipment when the factory is late.
 

Risks Hidden Inside an Average

An average lead time can hide:
 
  • component shortages;
  • quality rejection and rework;
  • missed factory handoffs;
  • factory shutdowns;
  • warehouse receiving queues;
  • missed carrier cutoffs;
  • space shortages;
  • customs inspection;
  • peak congestion;
  • destination receiving backlog.
Do not add a random number of “just in case” days for every risk. Measure actual variability where possible. Known calendar events should go into the replenishment plan first. Safety stock then protects the remaining uncertainty.


Four Ways to Calculate Ecommerce Safety Stock

There is no single best formula for every brand. Choose the method that matches your data quality and operating complexity.
safety stock for ecommerce

Method 1: Days-of-Cover Buffer for New or Low-Data SKUs

Safety stock = average daily demand × chosen buffer days
 
Suppose a new product is expected to sell 12 units per day. You choose a 14-day provisional buffer.
 
Safety stock = 12 × 14 = 168 units
 
This method is simple and easy to explain. It works as a temporary policy for a launch or low-data SKU.
 
Its weakness is equally simple: the buffer days are a judgment call. The formula does not directly measure demand variation or lead-time variation. Review it frequently as real data arrives.


Method 2: Average/Maximum Method

Safety stock = (maximum daily demand × maximum lead time) − (average daily demand × average lead time)
 
Assume:
 
  • average daily demand: 20 units;
  • maximum daily demand: 28 units;
  • average lead time: 30 days;
  • maximum lead time: 38 days.
Then:
 
Safety stock = (28 × 38) − (20 × 30) = 1,064 − 600 = 464 units
 
This method is practical when you have useful averages and maximums but do not have clean statistical data.
 
Still, be careful. One bizarre promotion or one very late shipment can inflate the maximum and make the buffer too large. Use a sensible lookback window and investigate outliers before treating them as normal risk.


Method 3: Service-Level Method With Stable Lead Time

When lead time is reasonably stable but demand varies, a common model is:
 
Safety stock = z × σd × √L
 
Where:
 
  • z = service factor linked to the target cycle service level;
  • σd = standard deviation of demand per period;
  • L = replenishment lead time measured in the same periods.
In plain English, standard deviation measures how widely demand moves around its average. The z-score translates a service-level target into a multiplier.
 
The National Institute of Standards and Technology provides background on the normal distribution and standard-deviation model used in many statistical planning approaches.
 
Illustrative Cycle Service Level
Approximate z-Score
90%
1.28
95%
1.65
97.5%
1.96
98%
2.05
99%
2.33
 
Suppose:
 
  • average demand is 20 units per day;
  • daily-demand standard deviation is 6 units;
  • replenishment lead time is 30 days;
  • target cycle service level is 95%, with an illustrative z-score of 1.65.
Safety stock = 1.65 × 6 × √30
Safety stock ≈ 54.2 units, rounded according to the brand’s policy
 
This result is much lower than the average/maximum example because the assumptions and risk model differ. That does not mean one answer is automatically correct. It means the formulas are asking different questions.
 
Cycle service level is the probability of avoiding a stockout during a replenishment cycle. It is not identical to fill rate, which measures the share of demand filled immediately from stock. Do not switch those terms casually in an SLA or planning model.
safety stock for ecommerce
 

Method 4: Variable Demand and Variable Lead Time

When both demand and lead time move, a commonly used independent-variability model is:
 
Safety stock = z × √(L × σd² + d² × σL²)
 
Where:
 
  • z = service factor;
  • L = average lead time in periods;
  • σd = standard deviation of demand per period;
  • d = average demand per period;
  • σL = standard deviation of lead time in the same periods.
This model combines uncertainty from sales and replenishment time.
 
Assume:
 
  • average daily demand: 20 units;
  • daily-demand standard deviation: 6 units;
  • average lead time: 30 days;
  • lead-time standard deviation: 4 days;
  • target cycle service level: 95%, using an illustrative z-score of 1.65.
Safety stock = 1.65 × √(30 × 6² + 20² × 4²)
Safety stock = 1.65 × √(1,080 + 6,400)
Safety stock ≈ 143 units
 
The lead-time variability has a large effect because average daily demand is multiplied by lead-time uncertainty.
 
This formula looks sophisticated. It can also produce polished nonsense if the data is poor. Clean stockout periods, distinguish planned promotional demand, and confirm how lead time is measured before trusting the output.
 

Which Formula Should You Use?

Situation
Recommended Starting Method
Main Warning
New SKU with little history
Days-of-cover buffer
Review weekly as actual demand develops
Basic history with useful averages and maximums
Average/maximum
Investigate extreme outliers
Stable lead time and variable demand
Service-level model
Demand periods must match lead-time units
Variable demand and variable lead time
Combined-variability model
Requires clean demand and lead-time data
Highly seasonal SKU
Forecast event demand first, then model uncertainty
Do not treat expected seasonal uplift as safety stock
Intermittent spare part
Cost-and-service policy plus specialized forecasting
Normal distribution may fit poorly
 
Inventory organizations often combine a mathematical result with practical constraints such as MOQ, shelf life, case-pack size, and cash limits. That is normal. The formula is an input to a decision, not a replacement for one.
safety stock for ecommerce
 

A Worked Example: How Much Inventory Should You Hold in China?

Let’s build one illustrative example for a phone-accessory brand.
 
The brand sells globally. Its supplier and fulfillment warehouse are in China, while fast-moving inventory is also replenished to a US warehouse.
 
For one SKU:
 
  • average daily demand: 40 units;
  • daily-demand standard deviation: 10 units;
  • average factory-to-China-warehouse lead time: 18 days;
  • lead-time standard deviation: 3 days;
  • target cycle service level: 95%;
  • illustrative z-score: 1.65.
Using the combined-variability formula:
 
Safety stock = 1.65 × √(18 × 10² + 40² × 3²)
Safety stock = 1.65 × √(1,800 + 14,400)
Safety stock = 1.65 × √16,200
Safety stock ≈ 210 units
 
Expected demand during the 18-day replenishment lead time is:
 
40 × 18 = 720 units
 
The China-warehouse reorder point is therefore:
 
720 + 210 = 930 units
 
When the China inventory position reaches about 930 usable units, the business triggers factory replenishment under this illustrative policy.
 
But that is not the end of the network decision.
 
The US warehouse has its own replenishment lead time from China. Suppose the China-to-US usable-inventory lead time averages 24 days and varies by 5 days. The US buffer protects a different section of the chain. You should not blindly copy the 210-unit China buffer into the US and call the job done.
 
Instead:
 
  • calculate the local buffer using US demand and China-to-US replenishment variability;
  • subtract confirmed pipeline inventory correctly;
  • avoid duplicating the same upstream risk at every node;
  • decide which location handles customer-service risk and which protects supply risk.
This is why safety-stock location matters as much as the total quantity.


Where Should the Safety Stock Sit?

The answer depends on the promise you make to customers and the risk you are trying to cover.
safety stock for ecommerce

Option 1: At the Supplier

Supplier-held stock can be useful when the supplier is reliable, production release is fast, and ownership is clear.
 
Possible advantages:
 
  • lower warehouse handling before release;
  • fast response to a production order;
  • components or finished goods remain close to the factory;
  • less capital tied up in downstream locations if the supplier owns the stock.
Possible risks:
 
  • the stock may be allocated to another customer;
  • inventory visibility may be weak;
  • quality has not been independently confirmed;
  • labels or packaging may not be fulfillment-ready;
  • commercial ownership may be unclear;
  • one supplier cannot consolidate products from other factories.
Do not count supplier-held inventory as available buffer unless the quantity, ownership, quality status, and release terms are documented.


Option 2: In a China Warehouse

Holding buffer stock in a China warehousing operation creates a controlled point between suppliers and international routes.
 
It can support:
 
  • inventory from several suppliers;
  • receiving and quantity checks;
  • quality inspection or exception handling;
  • kitting and bundle assembly;
  • export-ready packaging;
  • direct international order fulfillment;
  • replenishment to destination warehouses;
  • flexible carrier selection.
The main limitation is customer distance. Inventory in China still needs cross-border transit before it can serve a very short domestic delivery promise abroad.
 
China stock works especially well as an upstream buffer. It protects factory and origin uncertainty while giving the brand time to decide which market needs the inventory.
safety stock for ecommerce
 

Option 3: In a Destination-Country Warehouse

Local inventory supports faster customer delivery and reduces the time between an order and carrier handoff.
 
It is often the right location for:
 
  • stable fast movers;
  • concentrated demand;
  • marketplace replenishment;
  • products with strict delivery promises;
  • replacement items that customers need quickly.
The cost is commitment. Inventory is assigned to that market. If demand shifts, the brand may need discounts, transfers, or expensive returns to rebalance it.
 
Local stock also creates local storage, account minimums, and potentially duplicated buffers across several countries.


Option 4: Split Stock Across China and Destination Markets

A hybrid network uses an upstream China buffer and smaller customer-facing buffers in destination markets.
 
You do not need to become an inventory scientist to understand the idea. The China stock protects supply and replenishment. Local stock protects the customer delivery promise.
 
Location Model
Best Fit
Main Advantage
Main Risk
KPI to Watch
Supplier stock
Reliable supplier and simple product
Close to production
Weak control or allocation risk
Confirmed release time
China warehouse
Multiple suppliers and global demand
Flexible pooled inventory
Cross-border transit remains
Origin inventory accuracy
Destination warehouse
Concentrated demand and fast delivery
Short customer lead time
Local overstock
Local days of cover
Hybrid network
Stable core demand plus global long tail
Separates supply and service buffers
More planning complexity
Total network stock and fill rate
 
Do not duplicate a full “60 days of safety stock” at every warehouse. Calculate what risk each node protects. Otherwise a safety policy quietly becomes a stockpiling policy.
 

How Cost Changes the Right Safety Stock

The mathematically correct buffer may still be economically silly.
 
Safety stock should balance the expected cost of running out against the expected cost of holding another unit.
safety stock for ecommerce

Stockout Cost Can Include More Than Lost Revenue

Consider:
 
  • lost contribution margin;
  • canceled orders;
  • marketplace ranking or availability damage;
  • paused advertising efficiency;
  • emergency air freight;
  • customer-support work;
  • substitute or replacement shipping;
  • lost repeat purchases;
  • wholesale penalties or backorders.
A high-margin spare part with unpredictable demand may deserve a generous service level. The cost of holding one small part can be tiny compared with the cost of leaving a customer’s product unusable.
 

Carrying Cost Is More Than Storage Rent

It may include:
 
  • storage fees;
  • capital tied up in inventory;
  • insurance;
  • damage and shrinkage;
  • counting and handling;
  • expiry or product aging;
  • markdowns;
  • obsolescence;
  • disposal;
  • transfer or return costs.
Use the China fulfillment cost guide to build practical storage and operating inputs rather than treating inventory holding as free.
 

A Practical Cost Test

One useful decision principle is:
 
Hold another unit when the expected stockout cost it avoids is greater than the expected carrying and obsolescence cost of that unit.
 
This is not a complete statistical formula. It is a sanity check.
 
Suppose another 100 units cost $60 to hold during the relevant planning period. If those units are expected to avoid $400 of lost contribution margin and emergency freight, the buffer may be sensible. If they protect $40 of expected margin while facing a high risk of obsolescence, probably not.
 

Storage Density Changes the Economics

One cubic meter can hold a large number of phone cases and very few pieces of furniture. The same unit count can create wildly different storage costs.
 
Review:
 
  • pallet, bin, shelf, or cubic-meter billing;
  • packed dimensions, not only product dimensions;
  • case packs and master cartons;
  • stackability;
  • fragile or climate-sensitive storage;
  • slow-moving and long-term-storage fees.
This is one reason “keep 30 days of safety stock” cannot be a universal rule across every category.


Safety Stock by SKU Type and Growth Stage

Use different policies for different products.
 
SKU Type
Suggested Planning Approach
Reason
Stable fast mover
Statistical formula with a defined service level
Clean history and high stockout exposure
Volatile promotional SKU
Event forecast plus temporary buffer
Normal history understates event demand
New product
Analog SKU, preorder data, and staged buffer
Little direct history exists
Seasonal product
Seasonal forecast plus uncertainty
Known uplift is not safety stock
Slow mover
Cost-based minimum or low service target
Excess stock may cost more than a stockout
High-margin spare part
Higher service target where holding cost is low
Customer downtime makes shortages expensive
Expiry-sensitive cosmetic
Shelf-life and lot-aware cap
Overstock may expire before sale
Bulky low-margin item
Small buffer or make-to-order alternative
Storage and shipping are expensive
Bundle component
Shared-component planning
One missing component blocks several products
Marketplace bestseller
Channel-aware buffer and replenishment trigger
Stockout can hurt listing performance
 
A simple segmentation can borrow from ABC/XYZ thinking:
 
  • Value: Which SKUs contribute the most revenue or margin?
  • Variability: Which have stable versus unpredictable demand?
  • Risk: Which are hard to replenish or expensive to stock out?

You do not need to call the groups ABC, XYZ, or anything fancy. You do need different policies.
safety stock for ecommerce
 

How MOQ, Production Batches, and Supplier Reliability Affect the Buffer

MOQ and safety stock are not the same thing.
 
Minimum order quantity is a commercial or production constraint. Safety stock is inventory held against uncertainty.
 
Suppose a formula says you need 180 safety units, but the supplier MOQ is 2,000. Ordering 2,000 does not mean you now have 2,000 units of safety stock. Much of that is cycle stock created by the batch size.
 
Large MOQs can make the business look well protected while actually creating cash and obsolescence risk.
 
Review supplier performance by:
 
  • promised versus actual production time;
  • on-time delivery;
  • quantity accuracy;
  • defect and rejection rate;
  • rework time;
  • component availability;
  • response during peaks;
  • release flexibility;
  • emergency capacity.
A supplier with a slightly higher unit cost but stable lead time may reduce required safety stock and emergency freight. Compare total economics, not purchase price alone.
 
For some products, component-level safety stock is more efficient than finished-goods stock. Shared components can support several final SKUs. But this only works when final assembly, testing, packaging, and release are fast enough.
 
Dual sourcing can reduce dependence on one factory, though it adds qualification, quality, and coordination work. It is a risk-control tool, not free insurance.


Seasonality, Promotions, and Product Launches

Do Not Put Known Demand Into the Buffer

If a campaign is expected to add 5,000 units of sales, forecast those 5,000 units as planned demand. Then calculate the buffer around forecast uncertainty.
 
Otherwise the brand may double-count the event: once in the forecast and again in safety stock.
 
Build campaign plans from:
 
  • historical event uplift;
  • current audience size;
  • traffic and conversion assumptions;
  • preorder or waitlist data;
  • channel commitments;
  • advertising plan;
  • inventory already committed to other markets.

Use the Current Factory and Logistics Calendar

Known shutdowns, booking cutoffs, promotional events, and route constraints belong in planned lead time. Confirm the actual supplier and carrier calendar for the period you are buying.
 
Do not rely on a generic statement such as “add 30 days for China holidays.” Different factories, regions, product stages, and transport routes can have different schedules.
 

New Products Without Sales History

For a launch, use:
 
  • sales from analogous products;
  • preorder or crowdfunding data;
  • paid-media traffic assumptions;
  • retailer or marketplace commitments;
  • staged production;
  • smaller early replenishments where feasible;
  • frequent review after launch.
A large first purchase is not automatically safety stock. It may simply be an optimistic forecast wearing a warehouse label.


Recalculate and Rebalance Safety Stock

Safety stock is not a number you calculate once and laminate.
 
Demand changes. Suppliers improve or deteriorate. A product becomes more popular, less popular, or painfully unfashionable. Shipping routes change. Your target delivery promise changes too.
 

Use a Review Cadence That Fits the SKU

  • Weekly: launches, volatile bestsellers, stockout-prone products, and high-value promotional SKUs.
  • Monthly: active core products with meaningful sales history.
  • Quarterly: stable, low-risk products with long life cycles.
  • Event-based: after a supplier change, route change, price change, packaging redesign, channel launch, MOQ change, or major forecast update.
Do not recalculate every SKU every morning because the software can. Frequent noise can cause nervous purchasing and expensive overreaction.
 

Monitor the Inputs and the Result

Useful metrics include:
 
  • forecast error;
  • demand standard deviation;
  • average and variable supplier lead time;
  • stockout frequency;
  • cycle service level;
  • fill rate;
  • days of cover;
  • inventory turnover;
  • emergency freight spend;
  • aging and obsolete inventory;
  • storage cost by SKU;
  • inventory accuracy;
  • inbound and pipeline inventory.
Product identification and inventory data need to remain consistent across suppliers, warehouses, channels, and systems. The GS1 standards framework is a useful reference for standardized product and logistics identification, though your exact labels and fields should match the channels and facilities involved.
 

Rebalance Between China and Destination Warehouses

Review where demand actually occurred, not where the annual plan hoped it would occur.
 
Move or replenish stock based on:
 
  • regional sales velocity;
  • contribution margin;
  • stock age;
  • local stockout risk;
  • China-to-destination lead time;
  • parcel and freight cost;
  • marketplace availability requirements;
  • product restrictions;
  • return and transfer cost.


Common Safety-Stock Mistakes

Mistake
What Happens
Better Approach
Use one buffer percentage for every SKU
Bulky slow movers and small bestsellers receive the same policy
Segment by value, variability, cost, and replenishment risk
Use average lead time only
Delays disappear from the model
Measure lead-time variation as well as the average
Treat a known promotion as uncertainty
Event demand is counted twice
Forecast the event, then buffer the remaining error
Ignore inventory in transit
Duplicate purchase orders create overstock
Use inventory position, not on-hand stock alone
Treat MOQ as safety stock
Large production batches look like risk control
Separate cycle stock from the buffer calculation
Duplicate a full buffer at every warehouse
Network inventory grows much faster than demand
Define which risk each node protects
Count damaged or quarantined units as available
The system shows protection that cannot fulfill orders
Use usable inventory status
Never reduce the buffer after demand slows
Aging stock and storage cost increase
Recalculate on a defined cadence
Use observed sales during stockouts
Demand appears lower because the product was unavailable
Correct for stockout-censored demand where possible
Target 99% service for every product
Low-margin slow stock absorbs cash
Set service targets by economics and customer impact
 
There is one more subtle problem: changing the formula every time the answer feels uncomfortable. Pick a documented method, review its assumptions, and change it for a clear reason—not because the purchase order looks scary.


A 30-Day Safety-Stock Setup Plan

safety stock for ecommerce

Week 1: Clean the Data

Collect demand history, stockout periods, returns, promotions, supplier lead times, inbound dates, quality failures, packed dimensions, storage units, and inventory accuracy.
 
Define the lead-time start and end. “Order placed to goods usable in China warehouse” is a usable definition. “Supplier lead time” without start and end points is not.
 

Week 2: Segment SKUs and Select Methods

Group products by revenue or margin importance, demand variability, replenishment risk, shelf life, storage density, and lifecycle stage.
 
Choose:
 
  • a calculation method;
  • target cycle service level or business policy;
  • review cadence;
  • minimum and maximum practical buffer;
  • exception owner.
 

Week 3: Calculate Quantity and Location

Calculate the total safety stock and reorder point. Then decide where the buffer belongs.
 
For a hybrid network, document:
 
  • upstream China buffer;
  • local customer-facing buffer;
  • pipeline stock;
  • reorder and transfer trigger;
  • planned replenishment service;
  • emergency route.
Use a shipping cost calculator to compare replenishment routes and emergency options. Add warehouse receiving time and local availability time; transport cost alone does not show when inventory becomes usable.
 

Week 4: Put Triggers Into the Workflow

Configure WMS, OMS, ERP, or planning alerts. Assign responsibility for purchase-order review, supplier confirmation, inventory transfers, and exceptions.
 
Create a small dashboard. It should show what someone needs to act on, not 70 colorful charts.
 
At minimum, include:
 
  • current inventory position;
  • safety-stock target;
  • reorder point;
  • confirmed inbound;
  • days of cover;
  • supplier lead-time status;
  • forecast error;
  • aged inventory;
  • stockout and emergency-freight events.


Safety Stock Checklist for Inventory Held in China

  • Demand history is clean and segmented by SKU and channel.
  • Stockout periods are identified so sales do not understate demand.
  • Promotions and known seasonal uplift are forecast separately.
  • Supplier-production lead time has clear start and end points.
  • Origin warehouse, export, transit, customs, and destination time are measured separately.
  • The calculation method matches data quality.
  • The target service level reflects margin and customer impact.
  • MOQ and cycle stock are separated from safety stock.
  • Confirmed pipeline inventory is included in inventory position.
  • Damaged, quarantined, and reserved units are excluded from usable stock.
  • Storage density, capital cost, shelf life, and obsolescence are considered.
  • China and destination buffers protect defined risks.
  • The reorder point and purchase quantity are separate decisions.
  • Review cadence and exception ownership are documented.
  • Results are checked after supplier, route, product, or demand changes.


Conclusion

There is no universal answer such as “keep 30 days in China.” A useful safety-stock policy needs three decisions: quantity, location, and timing.
 
Calculate the buffer with the best method your data can support. Use the lead time that matches the inventory location being protected. Then place the stock where it covers the right risk—factory and origin risk in China, customer-service risk near buyers, or both in a hybrid network.
 
The goal is not zero stockouts at any cost. It is a sensible balance between availability, cash, storage, emergency freight, and obsolescence.
 
Start with the SKUs where a stockout hurts most or excess inventory costs most. Clean the data. Run the calculation. Check whether the result makes economic sense. Then review it as the business changes.
 
If you are deciding how much stock to hold in China, prepare SKU demand history, supplier lead times, MOQ, packed dimensions, storage requirements, destination mix, current stockout costs, and delivery promises before you request a tailored fulfillment quote.


FAQs

1. What is safety stock in ecommerce?

Safety stock is extra inventory kept to protect against unexpected demand or replenishment delays. It is separate from normal cycle stock and planned seasonal inventory. Ecommerce brands use it to reduce stockouts, canceled orders, emergency shipping, and lost sales when forecasts or supplier lead times are imperfect.
 

2. How do you calculate safety stock for ecommerce inventory?

The right method depends on the data. A new SKU may use average daily demand multiplied by buffer days. Brands with better history can use an average/maximum formula or a service-level formula based on demand and lead-time variability. Every period and lead-time unit must be consistent.
 

3. How many days of safety stock should an ecommerce brand hold?

 
There is no universal number. The required days depend on demand variability, supplier and transport lead time, service target, MOQ, margin, storage cost, shelf life, and stockout impact. A stable lightweight bestseller may justify more cover than a bulky, low-margin, slow-moving product.
 

4. What service level should I use for safety stock?

Use a service target that reflects the product’s economics and customer impact. High-margin bestsellers or critical spare parts may justify a higher target. Slow, bulky, low-margin products may not. Remember that cycle service level and fill rate are related but different measures.
 

5. Should safety stock be stored in China or near customers?

China stock can protect supplier and origin risk while keeping inventory flexible across markets. Destination stock protects fast customer delivery. A hybrid model can use both. Decide which uncertainty each location covers and avoid duplicating the full buffer at every warehouse.
 

6. How does supplier lead time affect safety stock?

Longer or more variable supplier lead time generally increases the required buffer because demand must be covered for a less predictable period. Measure production, quality, release, and inbound time consistently. A supplier with stable lead time may reduce total inventory even when its unit price is slightly higher.
 

7. Is MOQ the same as safety stock?

No. MOQ is the supplier’s minimum production or purchase quantity. Safety stock is inventory held against uncertainty. A large MOQ can create substantial cycle stock and excess inventory even when the calculated safety stock is small. Model the two separately.
 

8. How often should ecommerce safety stock be recalculated?

Review volatile launches and high-risk bestsellers weekly, core active SKUs monthly, and stable low-risk products quarterly. Recalculate after meaningful changes in demand, supplier performance, route, packaging, MOQ, product lifecycle, channel mix, or delivery promise.
 

9. How do you calculate safety stock for a new product with no sales history?

Start with analogous SKUs, preorder or crowdfunding data, traffic and conversion assumptions, retailer commitments, and a provisional days-of-cover buffer. Purchase in stages where possible and review frequently after launch. Separate the expected launch forecast from the uncertainty buffer.
 

10. Can a China 3PL help reduce total safety stock?

A China 3PL can support supplier consolidation, inventory visibility, receiving, inspection, pooled origin stock, direct international fulfillment, and planned replenishment to destination warehouses. Those capabilities may reduce duplicated buffers and shorten origin processing. The actual result depends on data quality, lead times, service design, and warehouse performance.
 
Post views Post Views:14

Get a Custom China Fulfillment Solution with FREE Storage for 30 Days

Want to know about our services, fees or receive a custom quote?

Please fill out the form on the right and we will get back to you within a business day.

The more information you provide, the better our initial response will be.

  • *

  • *

  • *

  • *

  • *
    Major destinations:

  • *

  • *

  • *

  • * Verification code