




Table of Contents
Get Custom eCommerce Fulfillment Service
Book a Meeting
ABC Inventory Analysis for Ecommerce Warehouses: A Practical Guide
Time: Aug 31,2026 Author: SFC Source: www.sendfromchina.com
Not every SKU deserves the same warehouse attention.
A high-margin bestseller that appears in 30% of orders should not be managed exactly like a $4 replacement cable that sells twice a month. Yet many ecommerce warehouses use one counting schedule, one replenishment rule, and one storage mindset for everything.
That feels fair. It is also inefficient.
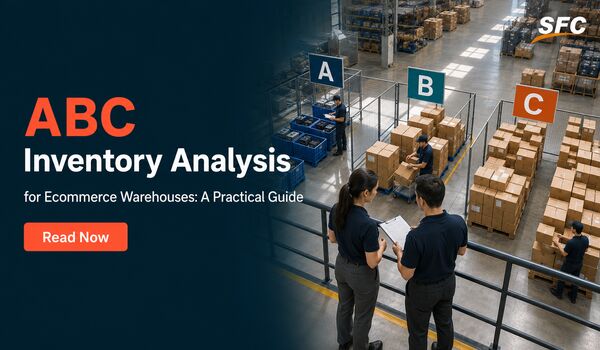
ABC inventory analysis helps you rank SKUs by importance and apply more control where mistakes or stockouts hurt most. The calculation is not difficult. The useful part comes afterward: changing warehouse placement, cycle counts, replenishment reviews, reporting, and exception handling.
This guide uses a four-step framework:
- Classify: Rank SKUs using a metric that matches the decision.
- Place: Store each class according to movement, value, dimensions, and handling needs.
- Control: Apply different counting, replenishment, and approval rules.
- Review: Reclassify as demand, margin, product lifecycle, channels, and suppliers change.
There is one warning up front. ABC analysis is often linked to the Pareto principle and a rough 80/20 pattern. That is a useful starting idea, not a warehouse law handed down on a stone tablet.
What Is ABC Inventory Analysis?
ABC inventory analysis is a selective inventory-control method that ranks items by their contribution to a chosen business metric.
The three classes usually mean:
- A items: the relatively small group responsible for the highest cumulative contribution;
- B items: the middle group with meaningful but lower contribution;
- C items: the larger or lower-priority group responsible for the remaining contribution.
Traditional ABC analysis often uses annual consumption value:
Annual consumption value = annual units used or sold × unit cost
The SKUs are ranked from highest to lowest. Their shares of total value are calculated, then accumulated until class boundaries are reached.
Enterprise inventory systems use the same general principle: assign items to groups based on selected criteria, then apply different controls to those groups. SAP’s official documentation describes ABC classification in inventory analysis as a way to group items according to relative importance.
What ABC Analysis Is Not
ABC analysis is useful, but it is not:
- a permanent label attached to a product forever;
- the same as sales velocity;
- a complete demand forecast;
- a safety-stock calculation;
- a reorder-point formula;
- a substitute for hazard, weight, expiry, security, or temperature rules;
- proof that C items do not matter.
A C-class spare part may sell rarely but be essential when a customer needs it. An A-class item by revenue may be bulky, return-heavy, and unpleasantly unprofitable. The chosen metric matters.

Choose the Metric Before You Rank SKUs
The best ABC metric depends on what you are trying to improve.
Annual Consumption Value
Annual consumption value = annual units × unit cost
Use this when the main question is purchasing attention, capital tied up in stock, or inventory-value control.
It highlights products that consume the most inventory investment. It may not identify the most frequently picked items or the highest-margin products.
Revenue Contribution
Annual revenue contribution = annual units sold × selling price
Revenue is easy to understand and often easy to export from an ecommerce platform. It is useful when the goal is protecting top-line sales.
Its weakness is margin blindness. A product generating $200,000 in revenue with heavy discounts, high returns, and expensive shipping can be less valuable than it looks.
Gross Margin or Contribution Value
Annual contribution = annual units sold × contribution margin per unit
This method is useful when profitability matters more than revenue. The definition of contribution should be consistent. Decide whether it deducts product cost, payment fees, shipping subsidy, returns, fulfillment, and advertising.
Do not let each department use a different margin definition and then wonder why the classes disagree.

Order Lines and Pick Frequency
For warehouse slotting, the strongest metric may be the number of order lines or pick visits.
Imagine two SKUs:
- SKU X sells 10,000 units, mostly in cartons of 100 to wholesale customers.
- SKU Y sells 8,000 units, one unit at a time across 8,000 DTC orders.
SKU Y creates far more pick visits. It may deserve prime pick-face space even if its annual value is lower.
Warehouse activity metrics can include:
- order lines;
- individual picks;
- units picked;
- replenishment touches;
- cubic volume moved;
- handling minutes;
- returns or inspection touches.
Multi-Criteria Scoring
Some brands combine annual value, margin, pick frequency, stockout impact, supplier risk, and handling difficulty.
For example:
Priority score = 30% annual contribution + 25% order-line frequency + 20% stockout impact + 15% supplier risk + 10% handling complexity
This can be useful. It can also become an opinion dressed as mathematics.
Document every score, weight, and data source. If nobody can explain why an SKU is A class, the model is too opaque.
Match the Metric to the Decision
|
Decision
|
Useful Starting Metric
|
Why
|
|
Purchasing attention
|
Annual consumption value
|
Prioritizes inventory investment
|
|
Profit protection
|
Contribution margin
|
Highlights financially valuable products
|
|
Warehouse slotting
|
Order lines or pick frequency
|
Reflects labor and travel
|
|
Cycle counting
|
Value plus transaction frequency
|
Focuses on costly or error-prone records
|
|
Customer-service priority
|
Stockout impact and demand
|
Reflects revenue and availability risk
|
|
Multi-location inventory
|
Regional contribution and velocity
|
Prevents global averages from hiding local demand
|
The practical lesson is simple: you may need more than one ABC view.
How to Calculate ABC Inventory Classes

Step 1: Select the Period and Clean the Data
A 12-month period is common when it represents normal business. Use a different period when the catalog is new, demand has shifted, or a full year would mix several business models.
Clean or flag:
- stockout periods;
- returns and cancellations;
- discontinued products;
- major promotions;
- one-time wholesale orders;
- new product launches;
- SKU merges or code changes;
- bundles and shared components.
If an item was out of stock for three months, observed annual sales may understate its importance.
Step 2: Calculate the Chosen Value
For traditional annual consumption value:
Annual units × unit cost
Use a consistent cost basis. Standard cost, landed product cost, or another approved cost can work. Mixing supplier price for one SKU with landed cost for another makes the ranking noisy.
Step 3: Rank SKUs From Highest to Lowest
The highest-value item comes first. Continue down the list.
Step 4: Calculate Share and Cumulative Contribution
For each SKU:
SKU share = SKU value ÷ total value × 100
Then add each share to the shares above it to calculate cumulative contribution.
Step 5: Set the Class Boundaries
A common illustrative starting point is:
- A: items covering roughly the first 70–80% of cumulative value;
- B: items covering roughly the next 15–20%;
- C: items covering the remaining 5–10%.
These are not universal standards. A concentrated catalog may reach 80% with five SKUs. A broad catalog may need hundreds.
The boundary should also remain understandable. If an SKU crosses the 80% line slightly, it may still make sense to keep the complete item in A rather than split hairs over 0.4 percentage points.
Worked Ecommerce ABC Inventory Example
The following example uses illustrative annual consumption value for ten SKUs. Values are rounded to two decimal places.
|
SKU
|
Product
|
Annual Units
|
Unit Cost
|
Annual Value
|
Share
|
Cumulative Share
|
Class
|
|
SKU-01
|
Wireless charger
|
12,000
|
$8
|
$96,000
|
32.54%
|
32.54%
|
A
|
|
SKU-02
|
Beauty refill kit
|
8,000
|
$7
|
$56,000
|
18.98%
|
51.53%
|
A
|
|
SKU-03
|
Smart-home sensor
|
3,000
|
$15
|
$45,000
|
15.25%
|
66.78%
|
A
|
|
SKU-04
|
Travel organizer
|
6,000
|
$5
|
$30,000
|
10.17%
|
76.95%
|
A
|
|
SKU-05
|
Fragile décor set
|
1,000
|
$20
|
$20,000
|
6.78%
|
83.73%
|
B
|
|
SKU-06
|
Charging cable
|
4,000
|
$4
|
$16,000
|
5.42%
|
89.15%
|
B
|
|
SKU-07
|
Skincare device head
|
500
|
$24
|
$12,000
|
4.07%
|
93.22%
|
B
|
|
SKU-08
|
Cotton storage pouch
|
2,000
|
$5
|
$10,000
|
3.39%
|
96.61%
|
C
|
|
SKU-09
|
Replacement strap
|
1,000
|
$6
|
$6,000
|
2.03%
|
98.64%
|
C
|
|
SKU-10
|
Printed insert pack
|
1,000
|
$4
|
$4,000
|
1.36%
|
100.00%
|
C
|
|
Total
|
|
|
|
$295,000
|
100.00%
|
|
|
In this example:
- four A items account for about 76.95% of annual consumption value;
- three B items bring cumulative value to about 93.22%;
- three C items account for the remaining 6.78%.
The example does not prove that every catalog should have four A SKUs. It demonstrates the ranking method.
Now comes the real question: what changes in the warehouse?
What the Warehouse Should Do Differently for A, B, and C Items
ABC analysis creates value only when the classes change an operating policy.

A Items: High Control and Easy Access
A items deserve close attention because errors, shortages, or delays affect a large share of the chosen value metric.
Possible policies include:
- frequent inventory review;
- tighter cycle-count schedules;
- faster discrepancy investigation;
- clear supplier and inbound milestones;
- carefully sized pick faces;
- short, safe pick paths when velocity supports it;
- stronger replenishment alerts;
- approval before unusual adjustments;
- secure storage for high-value products;
- documented backup routes or suppliers.
Do not automatically place every financial A item beside the packing bench. A high-value item that sells twice a month may waste prime space. That is why warehouse velocity needs a second lens.
B Items: Standard Control With Regular Review
B items often receive balanced policies:
- scheduled cycle counts;
- normal replenishment review;
- standard approval thresholds;
- medium-access storage;
- periodic class review;
- exception reporting when demand changes.
B items are easy to ignore because they are not the top group or the long tail. That is exactly why they deserve a stable review cadence. Today’s B item may be next quarter’s A item.
C Items: Simple, Low-Cost Control
C items usually justify simpler controls when their stockout impact and physical risks are low.
Possible policies include:
- less frequent counting;
- denser storage;
- locations farther from the main pick path;
- simpler reporting;
- larger but less frequent replenishment where carrying cost allows;
- aggressive review of obsolete or very slow stock;
- make-to-order or supplier-held alternatives.
C does not mean careless. A wrong C item can still create returns, customer complaints, or a blocked bundle. It means the amount of management effort should fit the impact.
Illustrative Class Policy Table
|
Policy
|
A Items
|
B Items
|
C Items
|
|
Inventory review
|
Frequent
|
Regular
|
Periodic
|
|
Cycle counting
|
Highest frequency
|
Medium frequency
|
Lower frequency where risk allows
|
|
Replenishment attention
|
Tight monitoring and escalation
|
Standard review
|
Simplified or grouped review
|
|
Warehouse location
|
Prime when velocity supports it
|
Normal access
|
Denser or secondary space
|
|
Discrepancy approval
|
Strong controls
|
Standard controls
|
Simplified within tolerance
|
|
Supplier monitoring
|
Detailed for supply-critical items
|
Normal
|
Exception-based
|
|
Obsolescence review
|
Important
|
Important
|
Often urgent for long-tail stock
|
The frequencies are policy examples, not universal standards. A regulated, expiry-sensitive, or theft-prone C item may need stronger controls than its financial class suggests.

Financial ABC Versus Warehouse ABC
One ABC list is often not enough for ecommerce.
Use two lenses:
- Financial ABC: annual consumption value, revenue, or margin.
- Warehouse ABC: order-line frequency, pick visits, or handling activity.
Example: Financial A, Warehouse C
A $900 device may produce high annual value but only 200 picks a year. It deserves financial control and secure storage. It does not necessarily deserve the easiest pick slot.
Example: Financial C, Warehouse A
A low-cost cable may appear in thousands of orders. Its annual inventory value is modest, but putting it far from packing adds walking to the whole operation.
Two-Lens Matrix
|
Combination
|
Meaning
|
Practical Warehouse Action
|
|
Financial A / Velocity A
|
High value and frequently picked
|
Prime controlled location, frequent counts, tight replenishment
|
|
Financial A / Velocity C
|
High value but slow moving
|
Secure storage, strong accuracy, no need for prime pick space
|
|
Financial C / Velocity A
|
Low value but frequently picked
|
Easy-access pick face, simple controls, frequent replenishment
|
|
Financial C / Velocity C
|
Low value and slow moving
|
Dense secondary storage, review for obsolescence
|
|
Financial B / Velocity A
|
Medium value and high activity
|
Accessible location and regular counts
|
|
Financial A / Velocity B
|
High value and moderate activity
|
Controlled accessible location and close monitoring
|
This matrix is more useful for slotting than one financial class alone.
ABC Analysis for Warehouse Slotting
Slotting decides where inventory lives inside the warehouse. ABC analysis can improve that decision, but physical reality gets the final vote.

Put Frequently Picked Items Near the Work
High-frequency picks often belong:
- near packing or consolidation;
- in the ergonomic “golden zone” between knee and shoulder height;
- on short, clear pick paths;
- in locations that can hold enough stock between replenishments;
- away from congestion caused by other fast movers.
Do not make the pick face so small that workers refill it every hour. Walking drops, but replenishment labor explodes. Warehouse optimization loves these small jokes.
A well-designed pick-and-pack process should balance pick travel, scan control, replenishment effort, order accuracy, packaging, and carrier cutoff.
Consider Product Affinity
Products often ordered together may belong near one another, even if their individual classes differ.
Review:
- bundles and kits;
- common variants;
- accessories sold with a main product;
- subscription combinations;
- inserts and branded packaging;
- replacement parts.
Affinity can reduce walking and order consolidation time. It can also create congestion if every popular item is squeezed into one aisle.
Physical Rules Override ABC Class
An item’s class does not override:
- weight and ergonomic limits;
- fragility;
- temperature or moisture needs;
- dangerous-goods rules;
- expiry or lot control;
- theft risk;
- pallet stability;
- oversized dimensions;
- fire and safety requirements.
A heavy A item should not sit on a high shelf because a spreadsheet called it important.
Use ABC Classes for Cycle Counting
Cycle counting checks selected inventory throughout the year rather than relying only on one complete annual count.

A common ABC policy counts A items more frequently because their errors affect more value or activity.
An illustrative schedule might be:
- A items: monthly or more often;
- B items: quarterly;
- C items: once or twice a year.
That schedule is not a standard for every warehouse. Adjust it for transaction frequency, shrinkage, product risk, contractual requirements, and historical accuracy.
Define the Count Policy Clearly
For each class, document:
- count frequency;
- acceptable variance;
- recount threshold;
- adjustment approval;
- root-cause requirement;
- reporting owner;
- whether open orders or moves must be paused.
Track inventory accuracy by class and reason code. If A items keep showing shortages after replenishment moves, the solution is not simply more counting. Fix the process creating the discrepancy.
High-velocity low-cost items may need frequent counts even when their financial classification is C. Again, use the two-lens model.
Connect ABC Classes to Replenishment and Safety Stock
ABC class can change how closely a SKU is reviewed. It does not calculate the safety stock or reorder point by itself.
Possible policies:
- A items: high-quality demand data, frequent lead-time review, fast exception escalation, and careful supplier monitoring.
- B items: regular parameter review and standard replenishment workflows.
- C items: simpler review, grouped purchasing, lower service targets where economics support it, or make-to-order alternatives.
Do not assume every A item requires huge safety stock. A high-value item with stable demand and reliable replenishment may need a modest buffer. A cheap component with erratic demand and long lead time may need more units.
Likewise, an A classification does not tell you the reorder point. It tells you that the inputs and alert deserve more attention.
The dedicated Safety Stock and Reorder Point articles should be linked after their live website URLs are published and verified. Their paths are not inferred in this document.
ABC Analysis Across China and Destination Warehouses
An SKU can have different classes in different locations.
A global bestseller may be an A item in the China warehouse, a local A item in the United States, and a C item in a smaller European market.

Global Class Versus Local Class
Use a global class for decisions involving pooled supplier inventory, total purchasing value, and company-wide risk.
Use a local class for:
- warehouse slotting;
- regional replenishment;
- cycle-count priorities;
- channel allocation;
- local aging and stockout decisions.
Do not let strong sales in one market put a slow-moving SKU in prime space everywhere.
Which Inventory May Stay in China?
A China warehousing operation can hold:
- global long-tail inventory;
- stock from several suppliers;
- shared components;
- products with uncertain regional demand;
- bundles assembled near origin;
- direct-shipping inventory;
- replenishment stock waiting for market allocation.
China storage can preserve flexibility. It does not provide next-day customer delivery abroad.
Which Inventory May Move Closer to Customers?
Destination warehouses often fit:
- stable regional A items;
- marketplace bestsellers;
- products with short delivery promises;
- frequently returned or replaced products;
- items with predictable local demand.
Hybrid Network Policy
|
SKU Profile
|
China Role
|
Destination Role
|
Replenishment Pattern
|
KPI
|
|
Global A / Local A
|
Upstream buffer and consolidation
|
Strong local availability
|
Frequent planned replenishment
|
Local in-stock rate
|
|
Global A / Local C
|
Pooled primary stock
|
Small or no local buffer
|
Replenish only when justified
|
Local inventory turnover
|
|
Global C / Local A
|
Limited origin backup
|
Prioritized local stock
|
Market-specific replenishment
|
Local fill rate
|
|
Global C / Local C
|
Central long-tail stock
|
Usually little local stock
|
Direct or infrequent replenishment
|
Carrying cost per order
|
This network view helps avoid duplicating every SKU in every market.
Combine ABC With XYZ Demand Variability
ABC tells you how important an item is under the chosen value metric. XYZ analysis tells you how predictable its demand is.
A simple interpretation is:
- X items: stable and relatively predictable demand;
- Y items: moderate variability, trend, or seasonality;
- Z items: irregular or difficult-to-predict demand.
The exact thresholds depend on the forecasting method and business policy.
Why the Combination Helps
|
Class
|
Meaning
|
Possible Policy
|
|
AX
|
High importance, predictable demand
|
Tight replenishment, strong availability, leaner buffer possible with reliable supply
|
|
AY
|
High importance, changing or seasonal demand
|
Event-aware forecast and close review
|
|
AZ
|
High importance, unpredictable demand
|
Senior attention, scenarios, supplier flexibility, careful risk control
|
|
CX
|
Low importance, predictable demand
|
Simple automated replenishment or larger economic batches
|
|
CY
|
Low importance, seasonal or moderate variation
|
Periodic review and event planning
|
|
CZ
|
Low importance, erratic demand
|
Low-stock, make-to-order, supplier-held, or discontinuation review
|
An AZ item may need more management attention than an AX item even when their annual value is similar. The uncertainty changes the control problem.
Do not turn ABC-XYZ into a nine-box poster that nobody uses. Assign one or two meaningful policies to each group.
Ecommerce Cases That Break a Simple ABC Model

New Products
A new product has little history. A low initial annual value may place it in C even when the brand expects it to become a major launch.
Use a provisional class based on:
- analogous products;
- launch forecast;
- preorder or crowdfunding demand;
- margin;
- strategic importance;
- marketing investment;
- supplier and replenishment risk.
Review weekly or monthly until the class becomes evidence-based.
Seasonal and Promotional Products
An annual total can hide timing. A product may be quiet for nine months and dominate orders for one season.
Use seasonal classes or shorter rolling periods where useful. Also separate normal stock from event inventory. A holiday item does not need prime pick space in April simply because it was A class in December.
Bundles and Shared Components
A component may have low standalone sales but appear in several high-value bundles. Classify it using total dependent demand and stockout impact.
The same applies to:
- branded inserts;
- packaging materials;
- chargers or adapters;
- common accessories;
- subscription-box components.
One missing cheap component can block thousands of dollars of finished-product orders.
High-Margin Slow Movers and Spare Parts
A slow-moving product can still be strategically important.
Examples include:
- replacement parts;
- warranty items;
- premium accessories;
- products required by a wholesale contract;
- components needed to keep a larger product usable.
Add a criticality or stockout-impact override instead of letting annual volume decide everything.
Bulky Low-Margin Products
Revenue may make a bulky product look important while storage, handling, damage, and shipping erase much of the contribution.
Use contribution margin, cubic volume, and handling cost. A product taking ten pallet positions should not be judged like a phone case sitting in one bin.
For practical storage and handling inputs, use the China fulfillment cost guide rather than treating warehouse space as free.
Returns and Refurbished Inventory
Gross shipped units can overstate real contribution when return rates are high.
Consider:
- net sales;
- return processing;
- resellable rate;
- refurbishment labor;
- damage;
- replacement orders;
- disposal.
A high-revenue, high-return item may deserve strong quality and returns controls even if its net financial contribution is weaker.
Common ABC Inventory Analysis Mistakes
|
Mistake
|
Consequence
|
Correction
|
|
Use revenue for every decision
|
Margin, labor, and inventory investment disappear
|
Match the metric to the decision
|
|
Treat 80/20 as a fixed law
|
Artificial boundaries distort the catalog
|
Use documented, illustrative thresholds
|
|
Classify only at parent-product level
|
Variants with different demand are hidden
|
Classify at the SKU level where operations require it
|
|
Ignore returns and stockouts
|
Contribution and demand are misstated
|
Clean data and flag unavailable periods
|
|
Use one global class in every warehouse
|
Local slotting and replenishment become inefficient
|
Classify by location for local decisions
|
|
Put all financial A items in prime pick space
|
Slow high-value items waste accessible locations
|
Add pick-frequency analysis
|
|
Never reclassify
|
Old winners and new bestsellers keep the wrong rules
|
Set a review cadence
|
|
Ignore physical storage rules
|
Unsafe or inefficient placement follows
|
Apply weight, hazard, expiry, and security constraints
|
|
Build an opaque multi-criteria score
|
Nobody trusts or maintains it
|
Keep weights and data transparent
|
|
Classify without changing policies
|
Analysis becomes a report, not an improvement
|
Assign class-specific actions and owners
|
The last mistake is the biggest. If A, B, and C items all keep the same location, count schedule, replenishment review, and exception process, the analysis has not changed the warehouse.
A 30-Day ABC Analysis Setup Plan
Week 1: Define the Decision and Clean the Data
Choose the first objective:
- purchasing priority;
- warehouse slotting;
- cycle counting;
- replenishment review;
- inventory placement across China and destination markets.
Collect and clean:
- SKU master data;
- unit cost;
- selling price and margin;
- annual or recent units;
- order lines and picks;
- returns;
- stockout periods;
- product dimensions and weight;
- location;
- supplier and lead time;
- product lifecycle.
Standardized product and location identifiers matter when data moves between suppliers, warehouses, channels, and systems. The GS1 standards library provides an authoritative reference for product and logistics identification, though exact fields depend on the operation.
Week 2: Calculate and Validate Classes
Calculate the chosen value, total, share, cumulative share, and class.
Then inspect the results manually:
- Does one promotion dominate the year?
- Was an important SKU out of stock?
- Is a high-value item being discontinued?
- Does a low-value component block important bundles?
- Are costs and margins reliable?
- Does the class make sense at each warehouse?
Do not override every surprising result. Surprise is often the point. Override only with a documented business reason.
Week 3: Apply Warehouse Policies
Assign class-specific rules for:
- location and pick face;
- cycle counting;
- replenishment review;
- discrepancy approval;
- supplier monitoring;
- service-level attention;
- aging review;
- reports and escalation.
Use ecommerce fulfillment services as a capability reference only after defining the exact multichannel inventory and service policies required.
Week 4: Measure and Automate
Add class fields to the WMS, OMS, ERP, or controlled data model. If classifications or inventory data need to move between systems, review the available API integration.
Build a dashboard with:
- inventory value by class;
- order lines by class;
- inventory accuracy by class;
- stockouts by class;
- aging stock;
- count completion;
- pick travel or labor where available;
- class changes;
- policy exceptions.
Assign an owner and review date. Quarterly review may work for a stable catalog. Fast-changing ecommerce brands may need monthly or event-based updates.
ABC Inventory Analysis Checklist
- The business decision is defined before selecting the metric.
- The classification metric matches purchasing, slotting, counting, or network goals.
- Costs, margins, units, order lines, returns, and stockouts are cleaned.
- SKU variants, bundles, components, and packaging materials are handled correctly.
- Each SKU’s share and cumulative contribution are calculated.
- Class thresholds are documented as business rules, not universal standards.
- Financial importance and warehouse velocity are compared.
- Physical safety, weight, fragility, expiry, and security rules override unsuitable placement.
- Every class has a cycle-count and replenishment-review policy.
- China and destination warehouses use local classes where needed.
- New, seasonal, critical, and strategic products have exception rules.
- ABC-XYZ is used only when it changes a practical policy.
- Class ownership and review cadence are documented.
- The warehouse measures whether classification improved accuracy, labor, stockouts, or carrying cost.
Conclusion
ABC inventory analysis is not mainly about labeling products A, B, and C. It is about spending warehouse attention where it creates the most value.
Use the Classify, Place, Control, Review framework:
- classify with a metric that matches the decision;
- place products using both importance and pick activity;
- apply class-specific counting, replenishment, and exception rules;
- review the classes as the catalog changes.
For ecommerce warehouses, a two-lens model is often best. Financial ABC protects inventory value and profit. Warehouse ABC protects labor, pick paths, and throughput.
Start with one objective and a manageable group of SKUs. Run the calculation. Check the surprising results. Then change the operating rules. A perfect classification that changes nothing is just a tidy spreadsheet.
If you want to apply ABC policies to a China fulfillment operation, prepare SKU sales, cost, margin, order-line frequency, dimensions, storage location, supplier, and destination data before you request a tailored fulfillment quote.
FAQs
1. What is ABC inventory analysis in ecommerce?
ABC inventory analysis ranks ecommerce SKUs by their contribution to a selected metric, such as annual consumption value, revenue, margin, or pick frequency. A items receive the most attention, B items receive standard control, and C items use simpler policies where risk allows.
2. What is the formula for ABC inventory analysis?
A traditional formula is annual consumption value = annual units used or sold × unit cost. Rank SKUs from highest to lowest, divide each value by the total, calculate cumulative contribution, and assign A, B, or C classes using documented thresholds.
3. What percentages should be used for A, B, and C inventory?
Common illustrative starting bands place A items in roughly the first 70–80% of cumulative value, B items in the next 15–20%, and C items in the remaining 5–10%. These are not fixed standards. Set boundaries that fit the catalog and decision.
4. How often should A, B, and C items be cycle counted?
A items are generally counted more frequently, B items on a regular middle schedule, and C items less often where risk permits. Exact frequency depends on transaction volume, value, shrinkage, product risk, contracts, and historical accuracy. High-velocity financial C items may still need frequent counts.
5. Where should A items be stored in a warehouse?
Frequently picked A items often belong in accessible, ergonomic locations near the main workflow. High-value slow-moving A items may need secure storage rather than prime pick space. Weight, dimensions, hazard, expiry, fragility, and congestion rules should override simple class-based placement.
6. Is ABC inventory analysis based on revenue or cost?
It can use either, depending on the decision. Annual consumption value uses unit cost and is useful for inventory investment. Revenue supports sales prioritization. Contribution margin supports profitability. Pick frequency is often better for slotting. Many ecommerce warehouses use separate financial and velocity views.
7. What is the difference between ABC and XYZ inventory analysis?
ABC ranks items by importance under a value or activity metric. XYZ groups items by demand predictability. Combining them separates high-value stable items, such as AX, from high-value unpredictable items, such as AZ, so replenishment and exception policies can differ.
8. How should new products be classified with no sales history?
Use a provisional class based on analogous SKUs, launch forecast, preorder data, margin, marketing investment, stockout impact, and supplier risk. Review frequently after launch. Do not let a low partial-year sales total permanently place a strategic new product in C.
9. Should the same SKU have different ABC classes in different warehouses?
Yes, when local demand or operating decisions differ. A global A item may be local C in a small market. Use global classes for company-wide purchasing and pooled stock, then local classes for slotting, cycle counting, replenishment, aging, and channel allocation.
10. Can a 3PL use ABC analysis to reduce fulfillment costs?
A 3PL can use ABC and velocity data to improve slotting, pick paths, cycle counts, replenishment, storage density, and exception reporting. Savings depend on accurate SKU and order data, physical warehouse constraints, system support, and whether the class policies are reviewed as demand changes.
 Post Views:942
 TAGS:
TAGS:
Copyright statement: The copyright of this article belongs to the original author. Please indicate the source for reprinting.
Previous Post
Cycle Counting vs. Full Stocktake: Which Inventory Audit Method Fits Your Brand?
Next Post
TAGS
Hot Research
Get Custom eCommerce Fulfillment Service
Book a Meeting
Get a Custom China Fulfillment Solution with FREE Storage for 30 Days
Want to know about our services, fees or receive a custom quote?
 Want to know about our services, fees or receive a custom quote?
Please fill out the form on the right and we will get back to you within a business day.
The more information you provide, the better our initial response will be.